What’s New – Commercial Valuation® R1.16.1
Introduction
The latest release of Commercial Valuation® (CV) includes new functionality along with updates to current functionality. This document serves as a high-level guide to the changes that have been made as part of the Commercial Valuation 1.16.1 release.
New Functionality
Risk Visualization
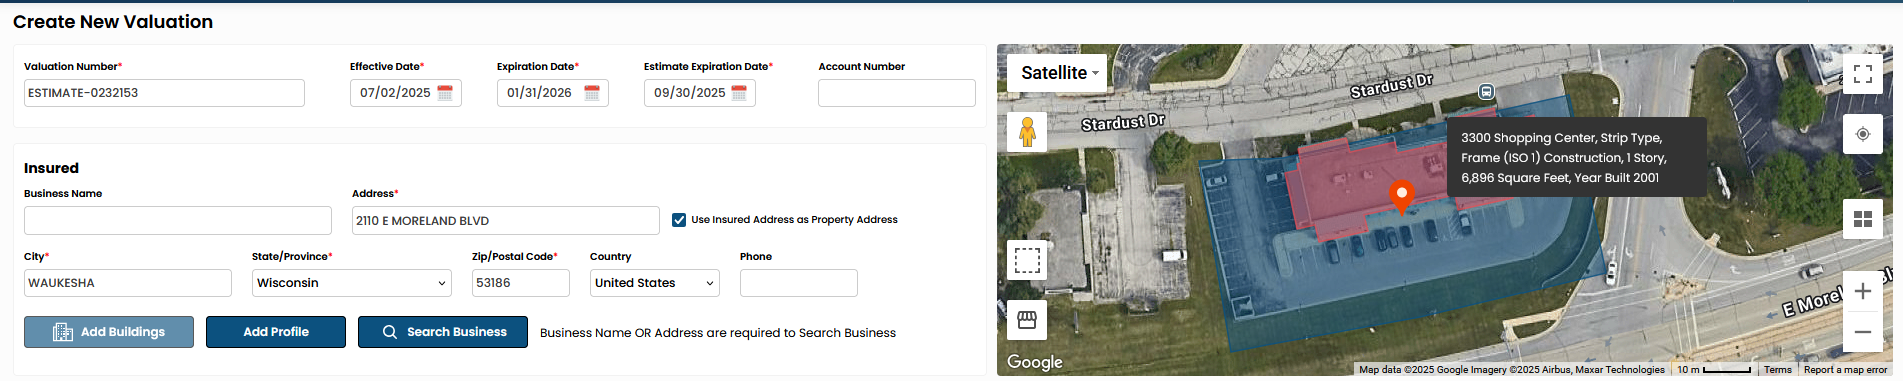
On the Create Valuation page, clients that license Building Prefill a map has been added to display the parcel boundary and the building polygons for those buildings where polygon data exists. This data coincides with building prefill. If there is no building prefill available for an address, then the map will not display any boundaries, but will show a point on the map to match the address.
Option to Display an Alternate Construction Type Description
An option was added to the system to display either the current CoreLogic Construction Type Descriptions or the ISO Construction Type Descriptions.
| Code | CoreLogic Description | ISO Description |
|---|---|---|
| 1 | Frame (ISO 1) | Frame (ISO 1) |
| 2 | Masonry (ISO 2) | Joisted Masonry (ISO 2) |
| 3 | Pre-Engineered Metal (ISO 3) | Non-Combustible (ISO 3) |
| 4 | Steel Frame (ISO 4) | Masonry Non-Combustible (ISO 4) |
| 6 | Protected Steel Frame (ISO 5) | Modified Fire Resistive (ISO 5) |
| 5 | Reinforced Concrete Frame (ISO 6) | Fire Resistive (ISO 6) |
| 7 | Structural Insulated Panel | Structural Insulated Panel |
| 8 | Pole Frame | Pole Frame |
If a switch to the ISO Descriptions is desired, please contact the Client Delivery Team.
Updates to Existing Functionality
Several updates to existing Commercial Valuation functionality have been addressed in the Commercial Valuation R1.16.1 release.
Construction Quality Display Consistency
On the User Interface (UI) the Construction Quality only showed the description (Average) and not the code (2.0). However, the report showed both the code and the description (2.0 – Average). Version 1.16.1 addresses this inconsistency. The UI has been updated to show both the code and the description to match the report.
Comparison Report
The Comparison Report from the Dashboard compares historical iterations. The report shows two columns Iteration 1 and Iteration 2. These headers don’t change regardless of which iterations are selected by the user. This has been updated to reflect the selected iterations.
If there is a specific reported defect or issue that you wish to understand or need more information, please contact your client services representative.
| Yes | No |